简体中文
简体中文

When considering what caused the sharp increase in the U.S. inflation rate from late 2020 to today, my initial instinct was to focus on aggressive monetary policy, following Milton Friedman's famous dictum that, "inflation is always and everywhere a monetary phenomenon." But while monetary policy is important, aggressive fiscal policy may have been more important this time.
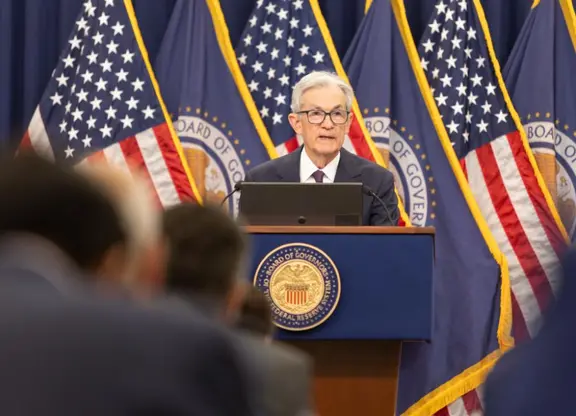
From March 2020 to March 2022, the U.S. Federal Reserve kept short-term nominal interest rates at zero while also using quantitative easing to expand its balance sheet from $4 trillion to an eventual $9 trillion. It is now generally acknowledged that the Fed was way behind the curve after late 2020, if not earlier. Because it did not raise its policy rate until the spring of 2022, it failed to keep nominal interest rates ahead of inflation, and thus lost control.
The problem with arguing that monetary policy was the sole source of the recent inflation is that the Fed was similarly aggressive during the "Great Recession" and its aftermath, from 2008 onward. Short-term nominal interest rates were fixed at zero for what turned out to be a seven-year period (early 2009 to late 2015). The Fed's balance sheet grew from $900 billion in August 2008 to more than $4 trillion – which seemed like a big number at the time. Yet inflation remained tame – averaging around 2 percent per year from 2009 to 2019 – and inflation expectations remained anchored at about the same value.
Why were the inflation results so different from 2020 on? An obvious difference between the two periods is the dramatic fiscal expansion that began in the spring of 2020 in response to the COVID-19 related recession, and which included federal transfers that dwarfed those associated with the "Great Recession."
To see how fiscal expansion translates into inflation, start with the volume of federal spending since the second quarter of 2020. The quarterly data up to the first quarter of 2022 show cumulative excess federal spending (above a pre-COVID baseline spending of $5 trillion per year) of $4.1 trillion – or 18 percent of 2021 GDP. The main spending surges (at annual rates) reflect outlays of $9 trillion in the second quarter of 2020 and $7 trillion in the third quarter of 2020, under former U.S. President Donald Trump, followed by $8 trillion each in the first and second quarters of 2021, under President Joe Biden.
To assess how inflation responded to this spending, I draw from the "fiscal theory of the price level," which has been advanced in research by the Hoover Institution's John H. Cochrane. Suppose the government does not plan to finance any of its additional spending by cutting other spending or raising taxes. If there is no formal default on Treasury bonds, "revenue" must come from inflation above the normal or expected level, which in turn reduces the real (inflation-adjusted) value of outstanding government bonds. Specifically, the inflation above 2 percent per year since mid-2020 can be thought of as cumulating to an unexpected boost in the price level, and this accumulation of excess consumer price inflation from May 2020 to July 2022 turns out to be about 11 percent.
The net nominally denominated public debt corresponds roughly to the publicly held part of the debt, which was $21 trillion in mid-2020 – or 91 percent of 2021 GDP. This concept subtracts from the gross debt the amounts held by federal trust funds and agencies but not the parts held by the Fed – as is reasonable because the Fed's holdings of Treasury and mortgage-backed securities are roughly balanced by the Fed's nominal liabilities. (One also could adjust for the federal debt that is CPI-indexed, but this amount is only around 7 percent of the total.)
The unexpected 11 percent boost in the price level lowered the real value of the net public debt by $2.3 trillion (equivalent to a default on 11 percent of the debt), which corresponds to effective revenue for the federal government. (Because the increase in the price level was a surprise, it should not have affected the nominal interest rates that the government had to pay on its bonds.)
To pay for the full $4.1 trillion of excess spending, the unexpected boost in the price level needs to be larger: in the range of 19 percent, rather than 11 percent(though even this larger number assumes, perhaps too optimistically, that the government will not have more spending surges in the future). Starting in July 2022, the required price-level accommodation can be accomplished by 9.4 percent inflation over one year, 5.7 percent average inflation over two years, or 3.5 percent average inflation over five years.
All these intervals are followed by 2 percent inflation. The result for five years is not far from the bond market's current breakeven inflation rate over a five‑year horizon. That is, the fiscal approach accords with expected inflation rates inferred from five‑year yields on conventional and indexed Treasury bonds.
So, a plausible argument is that the surge in federal spending triggered by the COVID-19 shock led to a permanent, unexpected rise in the price level by about 19 percent. This increase in the price level is a mechanism for financing the extra COVID-19 related spending. In a reasonable scenario, the CPI inflation rate comes down fairly quickly from its current value of 8.5 percentand averages around 3.5 percent over the next five years. While the inflation rate eventually returns to 2 percent, the upward surge in the price level is permanent.
The bottom line is that, although monetary policy was too aggressive for too long, the likely main culprit behind the recent high inflation was an extraordinarily expansionary fiscal policy.
(CGTN)