简体中文
简体中文

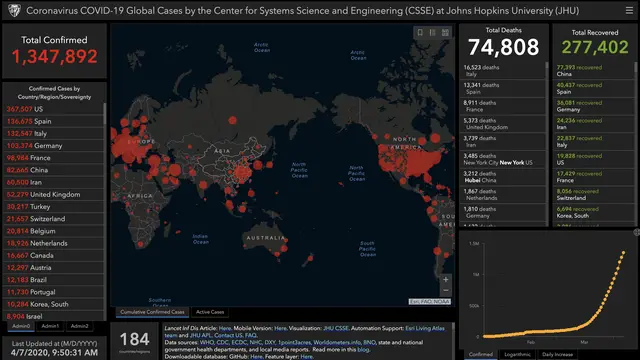
Screenshot of the COVID-19 tracking map on Johns Hopkins University's website.
As COVID-19 spreads across the globe, reporting data of new and total confirmed cases on a daily basis has become quite an important routine for news agencies around the world. Currently, most of the mainstream media are referencing the data from Johns Hopkins University's online dashboard when they report about the outbreak.
Launched on January 22, this
real-time tracking map
is created and maintained by Lauren Gardner,an associate professor in the Department of Civil and Systems Engineering at Johns Hopkins University, together with two Chinese students, Dong Ensheng and Du Hongru, first-year PhD students at the university's Center for Systems Science and Engineering.
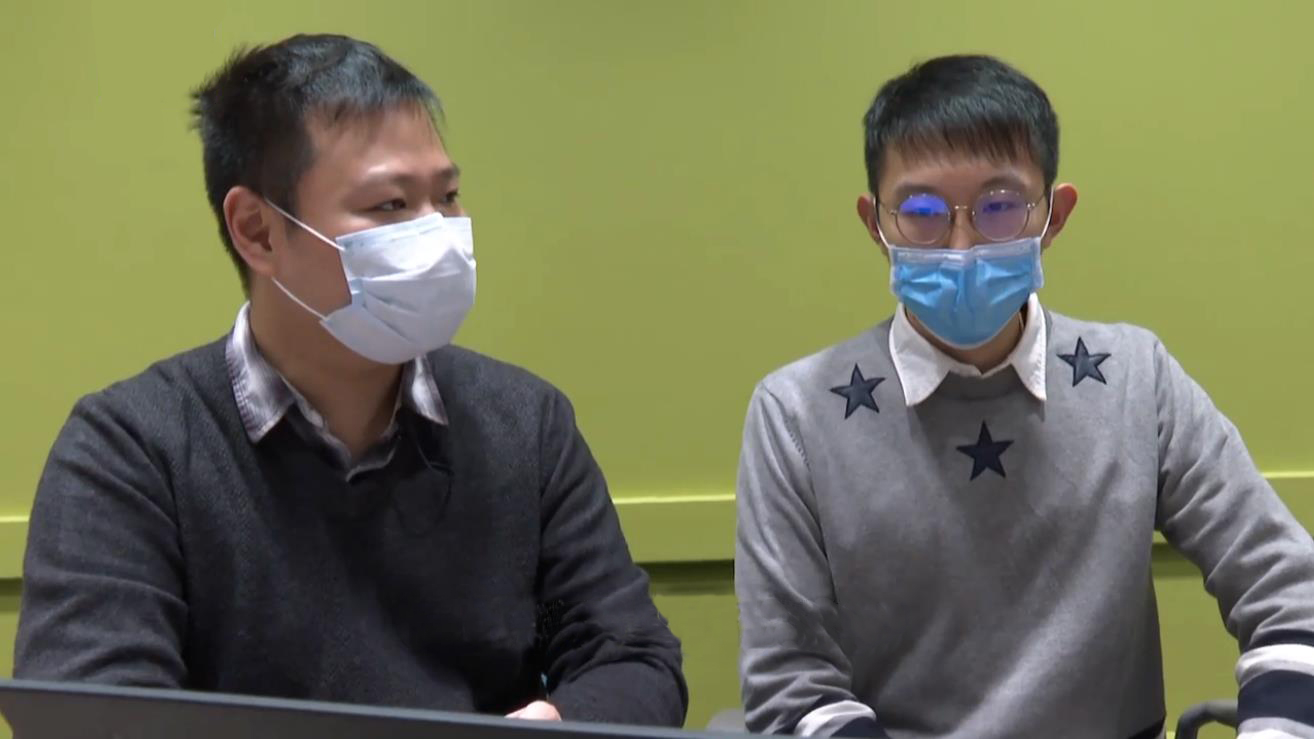
Dong Ensheng (L) and Du Hongru (R). /CCTV
"On January 21, we (Dong and his tutor) reached an agreement to make the interactive dashboard. I spent about seven to eight hours that night to complete the first edition. Then my tutor posted this dashboard on Twitter at around 11 a.m. on January 22," said Dong.
Their original intention to create this dashboard was to collect data for academic research. However, with the development of the epidemic, it has become the most cited source of epidemic data for government officials, public health scholars and mainstream media in many countries. Updating and operating this website has become Dong's "main business."
Dong and his tutor updated the map data manually twice a day, in the morning and evening. But as the pandemic unfurled,they found that manual updates were unsustainable, so they decided to automate parts of it and invited Du to work with them.
Joining the team on February 1, Du's main work is to write code for automatic updates and compare the data they collected with the numbers released by the World Health Organization (WHO), ensuring data consistency and accuracy.
"The most difficult thing is that these data sources are all in different formats and often different languages. We need to gather each data source, organize and adjust them into the format we need, then upload it to the dashboard," said Du.
"Basically, every time our server goes down, it's when there is a huge change in the epidemic," Dong told a local Chinese media outlet.
He said that there have been three peaks since the COVID-19 tracking map was launched. "The first time was when China changed their method for diagnosing cases. People found that the number of confirmed cases suddenly increased, and many of them went to our website. The second time was when the coronavirus broke out in Italy, and many Italian people flooded the website. Now is the third climax, mainly due to the outbreak in the United States," Dong explained.

A green field in front of Milton S. Eisenhower Library. /Johns Hopkins University's website
As the coronavirus continues to spread, the data that needs to be tracked is increasing. Dong's team has gradually grown from two or three people to now nearly 50 people, including other doctoral students in the department, volunteers from other colleges and some technicians from the company which provided technical support.
As of March 31, the website had over 15.5 billion visits worldwide, the highest number of visits even exceeded two billion in a single day. "In order to maintain the website, we have replaced three servers," said Dong.
Why does U.S. COVID-19 data come from a university not the government?